
How do I use TradingView: A Comprehensive Guide
TradingView is the most widely used charting program in the world. It is important to use a program to make your technical analyses. Because the exchange's chart is not clear and is more difficult to use to work accurately. TradingVieuw also keeps track of all important data and it does not expire automatically. But it can also be difficult for beginners. In this blog, the most important functions are explained, which is important to have in order and to spot good entries. We also explain certain tools. These are the best trading tools that traders should know in TradingView. At the end of the blog we also have a crypto giveaway.
TradingView is the number 1 chart program in the world. With this program you can easily make analyzes with many tools and indicators. It is easy to use for beginners and experienced traders. And it has 4 different versions of which 1 is free. This free program provides all the important tools for trading. You can find all assets in the program. Suppose you want to trade Bitcoin against the USDT at binance, then you can grab the BTC/USDT chart at binance. These prices are the same. It is mainly used for traders in crypto, forex and stocks. In short, all digital assets can be analysed. Read more about TradingView here. You can also connect your exchange and broker to TradingView. This is not mandatory.
Why use TradingView instead of the alternatives?
There are many other choices for alternatives from TradingView. We choose this program because it is the number 1 free program that works quickly and smoothly. When you use it you will find out how easy it works compared to the alternatives. the tools are good and it is not difficult to use them. TradingVieuw also doesn't show many distracting ads which makes it the best free chart program. The paid versions are also good. You only get extra functions there which are explained in the next paragraph.
Free Version or Paid TradingView.
In TradingView there are different subscriptions. In total there are 4 of which 1 is free. But why should I choose a paid version? There are 3 paid subscriptions. Pro, Pro+ and premium. If you pay on an annual basis, that saves costs. This way you can save $53 in 1 year. What can I do with these subscriptions?
Pro
use 5 different indicators in 1 chart. Advertising free, 2 charts per screen, set candlesticks at your own time, 20 server-side alerts. A multi-monitor support software.
Pro+
10 indicators per chart, Indicators on indicators function, 100 server side, intraday exotic charts, 4 charts per screen and charts based on custom charts.
Premium
25 indicators per chart publisgin invite indicators 4x extra chart data with 20k bars. Warnings that don't come anymore, 8 charts in 1 screen 400 server side alerts.
If you are new we recommend the free version because the paid version has extra things that are not necessary for beginners. If you do need one later, you can upgrade it. The free version has enough features.

Why and How Do I use TradingView 2023?
Why should I use a chart program like TradingView when every exchange also shows a chart? There are not many features in these charts and it is more difficult to find a trade. It is small and all your placed tools and data can suddenly be deleted. At TradingVieuw everything stays the same and it runs smoothly. It is essential for any profitable trader to use an external charting program. You can also easily view the chart on your phone with the Trading View app. If you trade forex or crypto it is important.
Customize candlesticks and chart in TradingView.
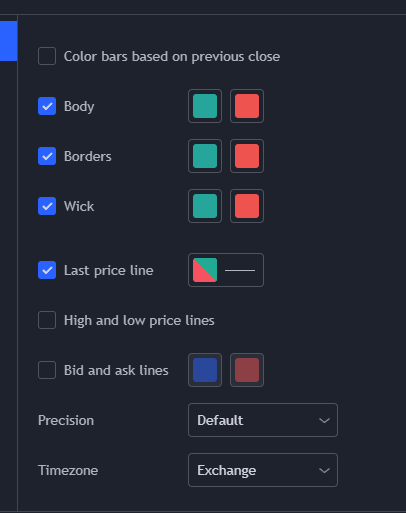
In the top bar you will see a symbol of candle sticks next to the time frame. This is probably correct after downloading or opening it in the browser. If not put it on candles that are the most used candle sticks because they are very clear. Right-click anywhere on your screen and select Settings>Symbol.
Now you see different options about the candle sticks. The body is the middle block of the candle and the wick is the thin line. And the borders the lines around the body. You can set these according to your own wishes if you do not like the standard colors. This is how you change the candle sticks. You can also change the time zone here in case you need it. We traded most on cryptocurrency and therefore use the Bitcoin chart in our blog.
Most traders have them set to red and green by default. But this is just what you find more comfortable. This will of course not affect your trades.
Customizing Candlesticks: Get a Clear Picture of Market Trends
Candlesticks are a popular tool for traders who want to get a clear picture of market trends and make informed trading decisions. In TradingView, you can customize your candlesticks to suit your individual needs. You can choose the color and style of your candlesticks, as well as the time frame that you want to view. This allows you to get a better understanding of market trends and make more informed trading decisions.
For example, if you're interested in short-term trading, you might choose to view your candlesticks over a 5-minute time frame. This will give you a clear picture of short-term market movements and help you make informed trading decisions. On the other hand, if you're interested in long-term trading, you might choose to view your candlesticks over a daily time frame. This will give you a clear picture of long-term market trends and help you make more informed trading decisions.
Customizing Charts: Tailor Your Trading Experience to Your Needs
In addition to customizing your candlesticks, you can also customize your charts in TradingView. This allows you to tailor your trading experience to your needs and get the most out of your trading. You can choose the type of chart that you want to view, such as a bar chart, line chart, or area chart. You can also choose the time frame that you want to view, as well as the color and style of your chart.
For example, if you're interested in technical analysis, you might choose to view a bar chart. This will give you a clear picture of market trends and help you make informed trading decisions based on technical indicators. On the other hand, if you're interested in volume analysis, you might choose to view an area chart. This will give you a clear picture of market volume and help you make informed trading decisions based on market volume.
Finding indicators in TradingView.
There are also indicators that you can use when trading. These indicators can show different data. Tradingview has a wide choice of indicators. If you have the basic version of TradingView (Free version) you can use up to 3 different indicators. There are also indicators from TradingVieuw that can only be used with a Pro package, but there are not many. To open an indicator, select in the top bar the option >indicators >search and type in what you are looking for and click on the indicator. Then it will be added to your chart. This appears at the bottom of your image or in the top left corner.
Hold your mouse over the indicator and select the 3 dots. Then select >settings. Then you will enter a menu which is different for each indicator of TradingVieuw.

What are the most important tools in TradingVieuw?
The most important thing about TradingView is the tools. These tools are important to visualize your trades. Here we are now going to explain the most important tools step by step how you can place them. Each tool also has settings. We will not discuss this, but to open it you can click on the tool in the left bar and then put it in the chart and then right-click > select settings. Here you can change a few things.
It is important to sign your support and resistance. Usually that requires a vertical line. Trading View has 2 lines for this. One line only goes from the point you put it and the other pulls it through from the front and back. To draw levels it is not very important which one you will use.
Placing Vertical Lines for Levels. (Support and Resistance)
Select the 2nd option in the toolbar. That is a slanted line and click the arrow next to it. Look for the Horizontal Line or the Horizontal Ray. You can also do ALT+H to use the keyboard shortcut. Then you can place it wherever you want.
After placing the line you will see a short menu somewhere in your screen with settings and thickness of the lines. There you can set all your settings for your lines. These are the same. With this line you can adjust the color and make it a dotted line and much more. This tool is important in TradingView because without levels you cannot make an analysis. Fortunately, making levels isn't complicated.

Place order boxes TradingView.
Order boxes are square boxes with a green and red area. Here you can place your entry, stop loss and take profit. This is useful because this data is in the exchange and it is easy to see. There are 2 different boxes. The long order and the short order. When trading you also use short orders, so that is useful. This box shows certain data. Namely whether you have won the trade, How much % your entry and stop loss is, And the PnL of the trade.
To grab this tool you can go to the 7th tool in the left toolbar. They are 3 vertical lines with dots through them. If you click on the right arrow next to the tool, you can also grab the short order box. They are called the Long Position and the Short Position. Click on the long or short you need and place it on your entry. Right click on the box and then >settings>inputs. There you can enter your entry, stop loss, and take profit price. This way the box will be exactly right on the penny. You can also simply drag the green, red and gray line. See the example of what it looks like in tradingview.

Measure Difference with Ruler.
You can measure things with a ruler. TradingView has a function that can help you measure how much % a certain piece has risen or fallen. This function is easy and has no settings.
To start using this function you can use the 9th function in the toolbar. That's a ruler symbol. If you take this tool and put it somewhere on the chart, you will see a box appear. See an example of the rise of the crypto currensy bitcoin. To use this tool with a hotkey, left click on the chart with shift. Then the tool is in use. When using the tool you can see how much the price has risen, % has risen, how much time it took and how many candles it is.
There is also another way to measure the change in price. Then click on the extra tools with the arrow next to the long and short order boxes. Then click Price Range. This is in Tradingview the same as the ruler. But with this one the measurement remains and with the ruler it disappears again when you click it away. In the example on the right, see all the tools on the bitcoin chart. The blue square is the ruler and the 3 different measurements in the square are the price range tools. These actually show the same thing.

How do I draw and type in TradingView?
Sometimes you like to draw in TradingView. Or do you like to type to keep things clear and make sure you don't forget something. There are 3 tools that we are going to cover here. Namely placing, typing and drawing symbols. These are not difficult.
Typing
It is useful to type in tradingView for several reasons. This tool is the 5th function in the toolbar. It's a T. Then click on the chart where you want to start typing and type your text. In the menu you can adjust various data such as the color and font. If you go to visibility, you can also choose not to show the text on some candles. This way you can keep text from scalping out of the day candles as it can otherwise be annoying.

Draw
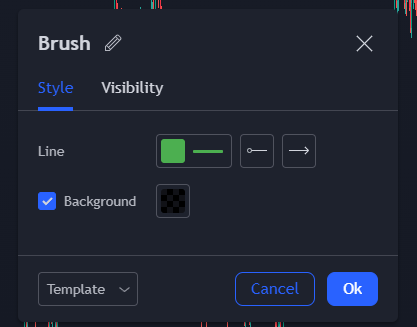
You can draw with the brush tool. You can then make signals. It is useful for many different things. You can use this tool easily. You can also give your drawn lines an arrow. How do I give my line an arrow at the start in tradingView? You can do that in the settings. The arrows and lines have many settings.
In the toolbar, click the 4th option (Brush) and set the data such as pixels and color and then click the gear icon to display more settings. There is an arrow next to the line option. Check it to create a line where an arrow arrives. If you click on visibility you can choose not to show the drawings for some time frames.
Place Symbols
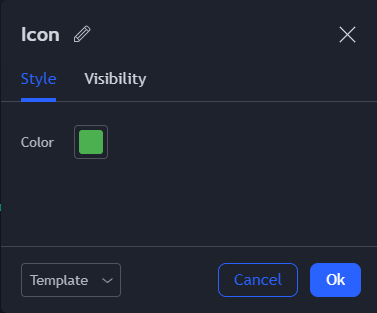
In 2023, there are many TradingView symbols. What are the TradingView symbols for? These are useful to show what is right or wrong by means of a cross and a check mark and much more you can do with symbols. Most symbols don't have much value. There are more than 170 symbols that you can use. Click in the 8th function to place a symbol and click the arrow next to it to open all symbols. Click anywhere in the chart where you want to place it. There will then be 4 different rounds. The top and bottom ones are for turning and the left and right ones for turning. If you want to drag it, you can drag the tool in the middle.
Choosing the Right Exchange in the Bybit Chart.
If you want to use TradingView well, you want the price of the exchange to match the chart program. You want that because the price is different per exchange. That is why a Binance chart is not useful when you place your trades on Bybit. It is not difficult to use the right exchange. Click in the top bar and search for the crypto currency you want to trade. Look on the right side of the window and click on Sources. Change All sources to the exchange you are using.
Now the time, date and price match those of your trade program.


Are there any other important tools in tradingView?
Yes, Trading View has many more tools. There are too many to mention, there are many more than 80. Most of which are not used much or never and are intended for experienced traders. These were the basic tools for traders. We have another crypto giveaway that you can enter at the bottom of the page. In the course of time that you start using TradingView you will probably find some interesting stuff. If you want to read more about this program you can go to the help program of TradingVieuw here. We hope to have taken you a little further with getting to know the program and how to start it with good knowledge. So these were the basic tools.
TradingView is a comprehensive trading platform that offers a wide range of tools and features to help traders make informed decisions and maximize their profits. From technical analysis to community trading, TradingView provides traders with everything they need to succeed in the markets.
One of the most important features in TradingView is the technical analysis tools. Technical analysis is the study of market data, such as price and volume, to identify trends and make informed trading decisions. TradingView provides traders with a range of technical analysis tools, including trend lines, moving averages, candlestick patterns, and more. These tools can be used to analyze historical market data, identify potential entry and exit points, and develop a trading strategy.
Custom Alerts: Stay Ahead of Market Movements
Custom alerts are a valuable tool for traders who want to stay ahead of market movements and make the most of their trading opportunities. With custom alerts, traders can set up specific triggers based on market conditions, such as price levels or technical indicators. Once the trigger conditions are met, traders will receive an alert, allowing them to quickly respond to market movements.
One of the key benefits of custom alerts is that they allow traders to automate their trading strategies. For example, if a trader has a strategy that involves buying a stock when its price reaches a certain level, they can set up a custom alert to notify them when this level is reached. This saves traders time and reduces the risk of missing out on a trading opportunity.
Another benefit of custom alerts is that they provide traders with greater flexibility and control over their trading. With custom alerts, traders can set up as many triggers as they need, based on their individual trading style and market conditions. This allows traders to be proactive and respond quickly to market changes, increasing their chances of success.
Community Trading: Benefit from the Collective Wisdom of the Group
Another key feature of TradingView is community trading. Community trading allows traders to connect with other traders, share their insights and analysis, and benefit from the collective wisdom of the group. This is a great way to gain new perspectives on the markets, validate your own trading ideas, and learn from the experiences of others.
One of the benefits of community trading is that it provides traders with a wealth of information and knowledge. With community trading, traders can access a range of opinions, analysis, and strategies, helping them to make more informed trading decisions. This is particularly useful for traders who are new to the markets or who want to expand their knowledge and understanding.
Another benefit of community trading is that it helps traders to validate their own trading ideas. By sharing their insights and analysis with other traders, traders can receive feedback and see how others interpret market movements. This can help traders to refine their trading strategies and make better decisions.
In conclusion, custom alerts and community trading are two powerful features in TradingView that can help traders maximize their profits. Whether you're a beginner or an experienced trader, TradingView has everything you need to succeed in the markets. So why not sign up for a TradingView account today and start making the most of your trading opportunities!
Have a Chance to win $1500 Bitcoin!

Maximizing Your Trading Profits with TradingView: Your Journey to Success
We hope that this comprehensive guide has helped you understand the many features and tools available in TradingView and how to use them to maximize your trading profits. Whether you're a beginner or an experienced trader, TradingView has everything you need to succeed in the markets.
From customizing candlesticks and charts to utilizing community trading and custom alerts, TradingView offers a wide range of features that can help you make informed trading decisions. By taking advantage of these tools, you can increase your chances of success and achieve your trading goals.
So what are you waiting for? Start customizing your charts and candlesticks, utilizing community trading and custom alerts, and take control of your trading profits with TradingView today! With its user-friendly interface and powerful features, TradingView is the perfect platform for traders of all levels.
In conclusion, we want to thank you for taking the time to read this comprehensive guide to using TradingView. We hope that you found it informative and useful, and that you're ready to start maximizing your trading profits with TradingView. So why not sign up for a TradingView account today and start your journey to trading success!
Share a page of intertradeclub.com with your friends for a chance to win $200 Bitcoin!
Create Your Own Website With JouwWeb